Wikis > Sales By Summary Group By Revenue Center

Sales By Summary Group By Revenue Center Graph Report

Contents

The Sales By Summary Group By Revenue Center graph report shows the total quantity and value of sales in all the summary groups within the selected date range. The totals are sorted by highest total value of sales. The total quantity and value of all sales within the selected date range are shown at the bottom of the report along with a pie chart showing the percentage of all sales each summary group represents.

Summary View

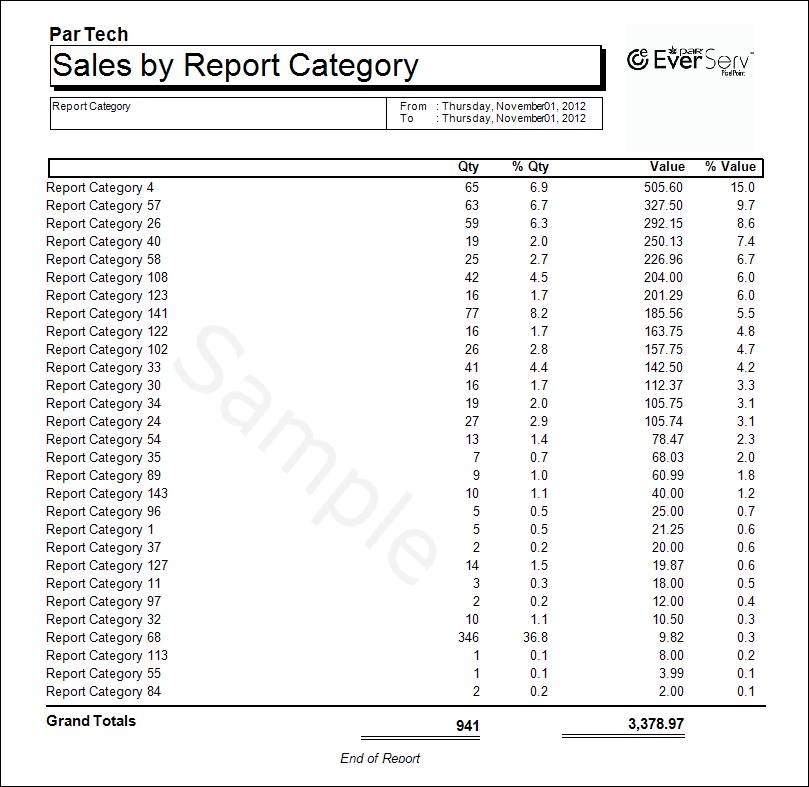
SalesBySummaryGroupByRevenueCentreGThe summary view shows the totals for quantity of sales of each summary group sold in each revenue center, the percentage of sales quantity a summary group represents, the value of sales, and the percentage of sales value a summary group represents across the selected date range. The grand total quantity and value of transactions within the selected date range is totaled at the bottom of the report.

Detailed View

SalesBySummaryGroupByRevenueCentreG-Detailed-1SalesBySummaryGroupByRevenueCentreGDetailedDetailed view contains all the information above: the totals for quantity of sales  of a summary group, the percentage of sales quantity a summary group represents, the value of sales and the percentage of sales value a summary group represents across the selected date range; additionally, detailed view shows the same information for each product under each report category. The grand totals are provided at the bottom of the report.

TopMain Report Page

Comments are closed.