Revision for “Sales by Revenue Center” created on 28 April, 2014 @ 15:24

Title
Sales by Revenue Center
Content
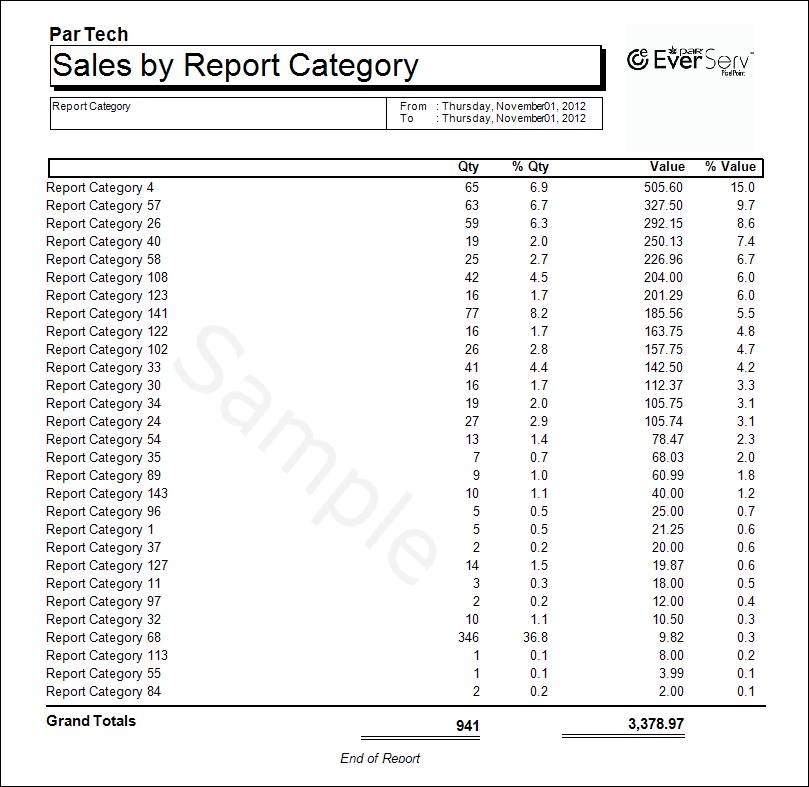
<h1>Sales by Revenue Center Report</h1> <a href="http://pixelpointreports.com/wp-content/uploads/SalesByRevenueCenter-1.png"><img style="max-width:51%;" class="alignright wp-image-1035" src="http://pixelpointreports.com/wp-content/uploads/SalesByRevenueCenter-1.png" alt="SalesByRevenueCenter-1" width="453" height="273" /></a> <a href="http://pixelpointreports.com/wp-content/uploads/SalesByRevenueCenter-2.png"><img style="max-width:51%;" class="alignright wp-image-1036" src="http://pixelpointreports.com/wp-content/uploads/SalesByRevenueCenter-2.png" alt="SalesByRevenueCenter-2" width="454" height="450" /></a> This report shows a chart of report categories sales by the revenue center where the sale was processed within the selected date range. The chart contains the quantity and value of sales for each revenue center and the total of all revenue center sales for each report category. &nbsp;
Excerpt


OldNewDate CreatedAuthorActions
28 April, 2014 @ 15:24 dedwards

Comments are closed.