Profit By Category Graph Report
Contents
- Profit By Category Graph Report
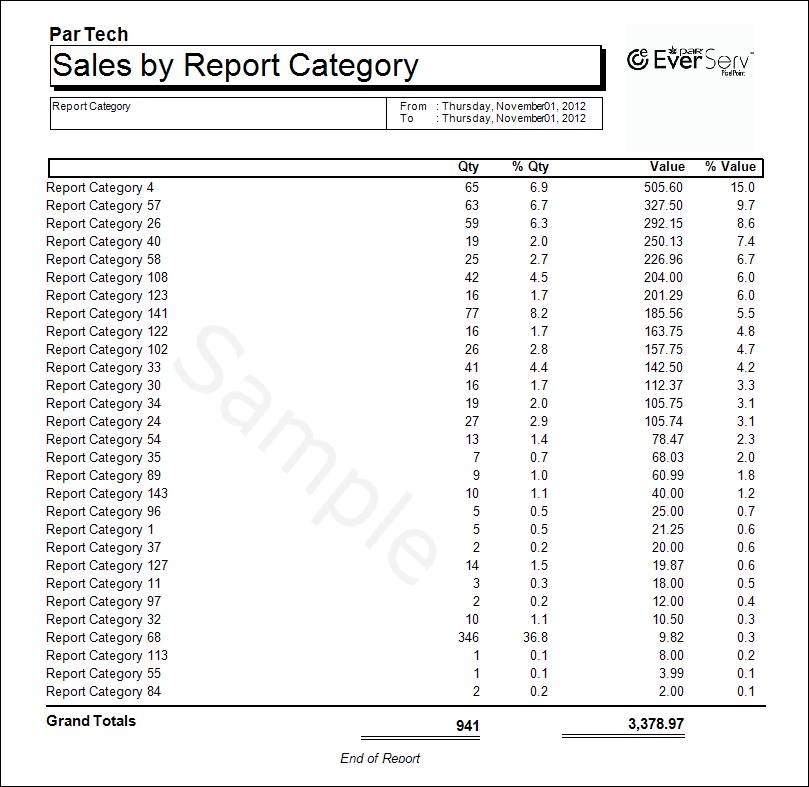
The Profit By Category graph report shows the total quantity and profit value of report categories, sold within the selected date range. The totals are sorted by highest total value of profit. The total quantity and profit value of all sales within the selected date range are shown at the bottom of the report.
Summary View
The summary view shows the total quantity and value of all purchases made under each report category within the selected date range. The cost of products sold and cost percentage of sale value for all products sold under that report category are then compared to the gross sales to show the net profit.
Detailed View
The detailed view shows the products sold in each report category and the total quantity and value of the products sold within the selected date range. The cost of products sold and cost percentage of sale value for each product sold are then compared to the gross sales to show the net profit.