Revision for “MealTime Stats” created on 26 May, 2014 @ 12:00

Title
MealTime Stats
Content
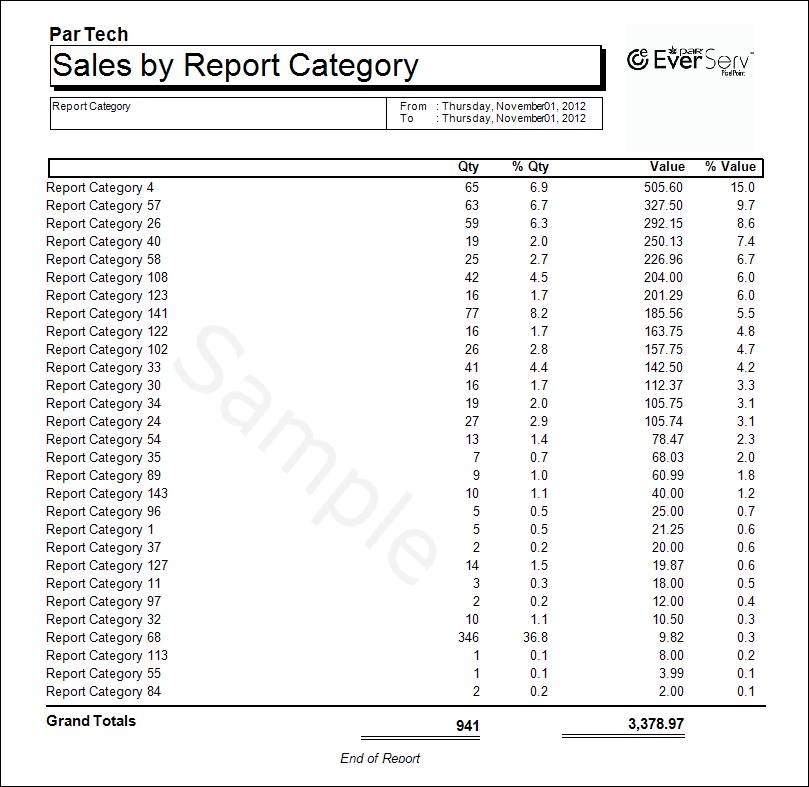
<h1>MealTime Stats Report</h1> <a href="http://pixelpointreports.com/wp-content/uploads/MealTimeStats.png"><img style="max-width:51%;" class="alignright wp-image-655" src="http://pixelpointreports.com/wp-content/uploads/MealTimeStats.png" alt="MealTime Stats" width="533" height="359" /></a>The MealTime Stats report charts the quantity of transactions and value of sales by mealtim,e and in addition to the number of customers, average customer per transaction, and the average time of each transaction for each mealtime across the selected date range. The report only includes tangible items which reduce inventory, like ordering products and options; it does not include non-tangible items such as rentals and cover charges.  Totals for these statistics are shown at the bottom of the report. <a id="novisit" style="line-height: 1.714285714; font-size: 1rem;" title="Return to Top" href="#top"><em>Top</em></a> - </span><a id="novisit" style="line-height: 1.714285714; font-size: 1rem;" title="Home" href="http://pixelpointreports.com"><em>Main Report Page</em></a>
Excerpt


OldNewDate CreatedAuthorActions
26 May, 2014 @ 12:00 dedwards
7 April, 2014 @ 16:50 dedwards

Comments are closed.