Employee Sales by Summary Group
Contents
- Employee Sales by Summary Group
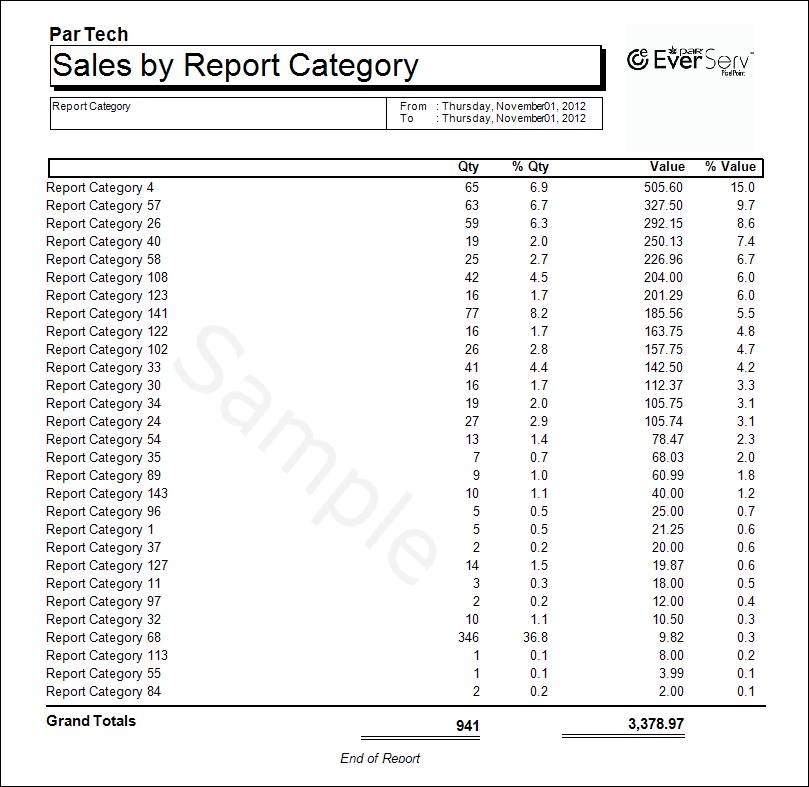
The Employee Sales by Summary Group report shows the quantity and value of all sales within the selected date range sorted by employee and broken down by Summary group, the larger product organization groups, usually food, beverages and alcohol.
Summary View
The summary view shows each employee sales by summary group. Four columns display the quantity sold, the percentage of the total quantity sold within the selected date range, the value of items sold, and the percentage of the total value sold within the selected date range. A final total for each employee is displayed at the bottom of the row for that employee.
Detailed View
The detailed view includes the product categories within each summary group. The Four columns display the quantity sold, the percentage of the total quantity sold within the selected date range, the value of items sold, and the percentage of the total value sold within the selected date range, but only show the percentages for the summary group. A final total for each employee is displayed at the bottom of the row for that employee.