Revision for “Future Order Products” created on 2 May, 2014 @ 13:29
Title | Future Order Products |
---|---|
Content | <h1>Future Order Products Report</h1>
<div id="toc_container" class="toc_wrap_right no_bullets">
<p class="toc_title">Contents</p>
<ul class="toc_list">
<li>Future Order Products Report
<ul class="toc_list">
<li><a href="#summary-view">Summary View</a></li>
<li><a href="#detailed-view">Detailed View</a></li>
</ul>
</li>
</ul>
</div>
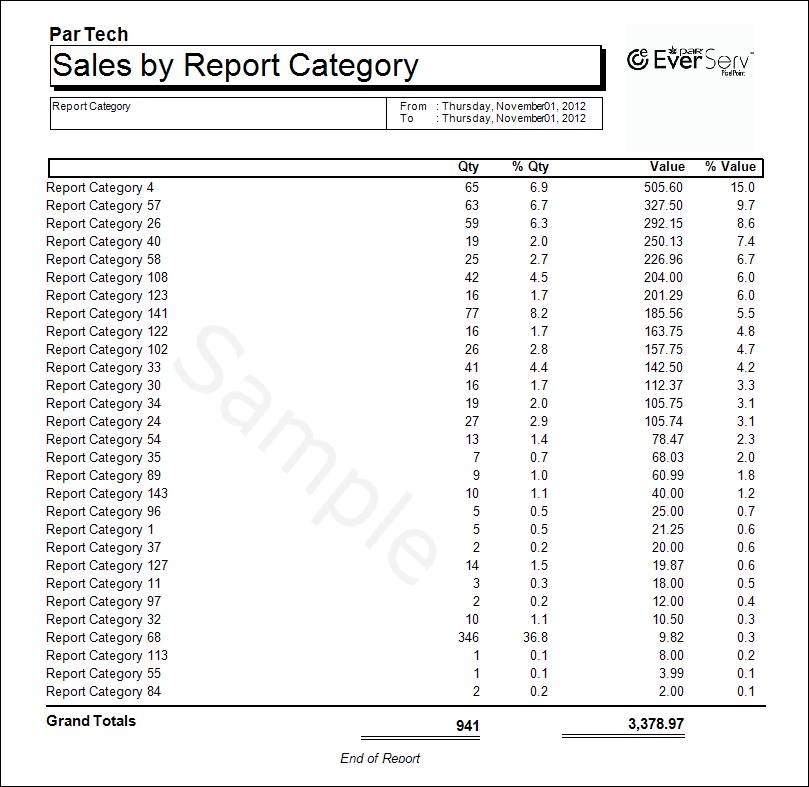
The Future Order Products report displays the sales information on delivery orders that were scheduled well in advance as a future order. Organized by the different report categories, each report type offers two views: the first is a sales summary of the each report category, and the second is a detailed view which breaks down the information into the individual products within each report category.
<h3 id="summary-view">Summary View</h3>
<a href="http://pixelpointreports.com/wp-content/uploads/FutureOrderProducts.png"><img style="max-width:51%;" class="alignright wp-image-1129" src="http://pixelpointreports.com/wp-content/uploads/FutureOrderProducts.png" alt="FutureOrderProducts" width="401" height="147" /></a>The summary view organizes information by report category, and shows the total number of items sold in each report category, the percentage of the total number of items sold each category represents, the total value of items in the category that was sold, and the total percentage of value each category represents. All these values are then totaled at the bottom of the report.
<h3 id="detailed-view">Detailed View</h3>
<a href="http://pixelpointreports.com/wp-content/uploads/FutureOrderProductsDetailed.png"><img style="max-width:51%;" class="alignright wp-image-1130" src="http://pixelpointreports.com/wp-content/uploads/FutureOrderProductsDetailed.png" alt="FutureOrderProductsDetailed" width="432" height="247" /></a>When viewed in detail, the Future Order Products report reveals the individual products within each report category and the total quantity and value of each product sold via future orders across the selected date range. At the bottom of each report category is the total quantity and quantity percentage, and the total value and value percentage sold for that category across the selected date range.
<a id="novisit" title="Return to Top" href="#top"><em>Top</em></a> - <a id="novisit" title="ReportViewer Reports" href="http://pixelpointreports.com/"><em>Main Report Page</em></a> |
Excerpt |